NASA specialists have created a new map of the world's ocean currents. Its difference from all previous ones is interactivity - anyone can independently look at all the stable water flows and determine the temperature nature of the flow.
Did you know that ocean water is heterogeneous? It is logical that closer to the surface it is warmer than at depth. However, not everyone knows that the volume of salt in ocean water, with rare exceptions, is inversely proportional to the depth at which this water is located - the deeper, the fresher it is. However, there are exceptions to this rule. For example, in the Arctic and Antarctic, deep waters are also saturated with salt - ice layers that penetrate to great depths contain particles of surface salt evaporation, enriching the entire water layer with them.
The top layer of ocean water is driven by stable air currents. Thus, the map of ocean currents is generally identical to the map of sea winds.
Unique online map
A unique map with which you can examine in detail the currents of all the oceans of the world
The model was developed to demonstrate the mechanism of thermal circulation in the world's waters. However, the map is not absolutely accurate - in order to better demonstrate the difference between surface and deep water flows, in certain areas the depth indicator is somewhat overestimated in relation to the real one.
The animation component of the new map was modeled by NASA scientists at the Goddard Space Flight Center laboratory.
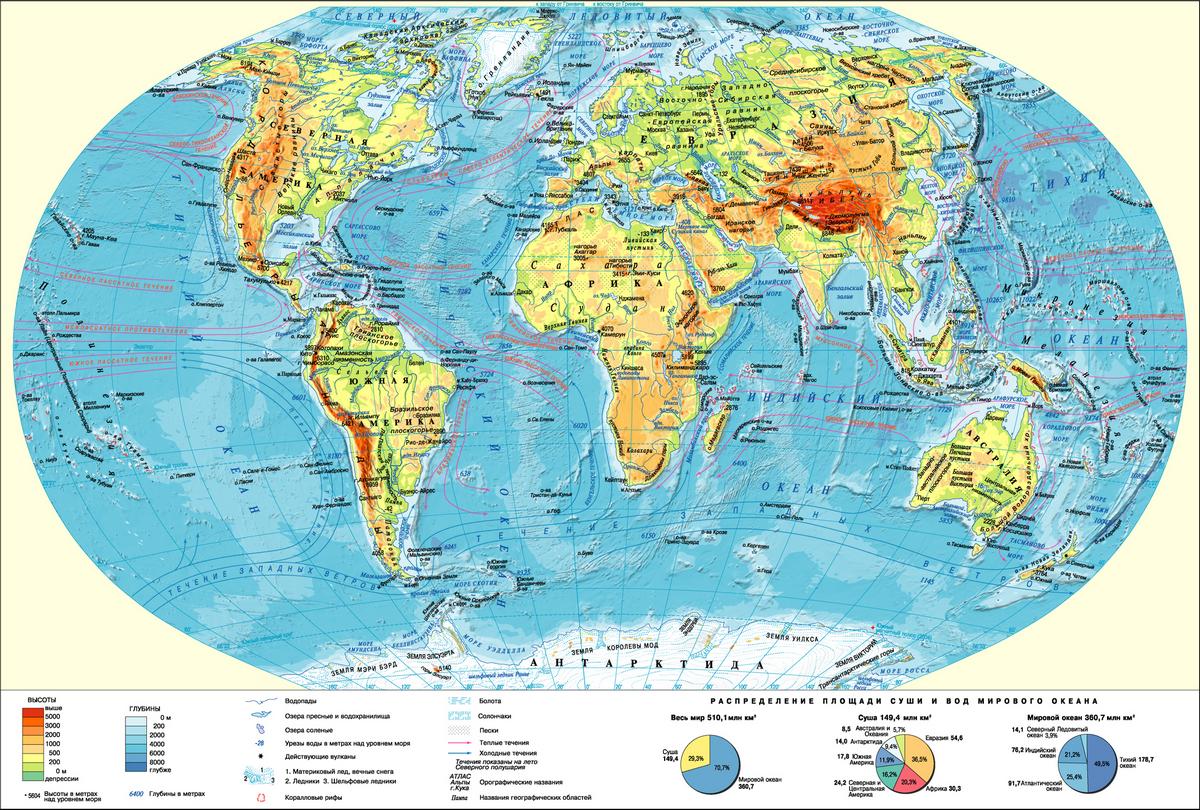
Comparative current contour map
Below is a classic contour map of the world's ocean currents in Russian, which schematically displays all the main cold and warm currents of the world's oceans. The arrows indicate the direction of movement, and the color indicates the temperature characteristics of the water - whether a particular current is warm or cold.